Many of us learn biostatistics in school. We learn lots of equations, and how to use different software, like SPSS, STATA, etc… And some even learn lots of python programming to do complex statistics, but many of us don’t have the foundation of what tests to use when… It’s overwhelming and daunting just to learn all the tests and formulae, but without knowing how or when to use them. Many students concentrate on “p-values” simply because they think they have to report these in their reports/theses. My advice for my own students/mentees are these:
- If you have already passed your exams and still don’t understand your lecture notes, don’t focus on your lecture notes again. Start learning the basic concepts from other online resources. There are tons of good resources out there.
- Don’t focus on p-values and the formulae – there are statistical software to do this. Learn how to create good hypotheses in the context of your own study.
- Learn to identify whether your data is parametric (follows the bell-curve) or non-parametric – you MUST be clear about which of your OWN study’s data is parametric/non-parametric.
- You MUST know whether you are analyzing your OWN study’s data as nominal, ordinal or continuous data. You may think this is easy, but it really depends on the context of your own study’s data.
Is my survey data nominal, ordinal or continuous?

In your statistics classes, you would probably have already gone through what these sorts of data are and what they encompass. But it gets a little less obvious when you are using Likert-scales in your surveys, and obtaining perceptions and/or experiences of your participants.
For example, you are using a 5-point Likert agreement scale (1-Strongly Disagree to 5-Strongly Agree) to determine your participants’ perceptions.
- Depending on your own Likert-scale, the participants’ data can be analyzed as follows:
- Agree (scale points 4-5) versus Disagree/Neutral (scale points 1-3) –> In this case, you are categorizing your data as 2 groups of NOminal data (there is No Order to your data).
- Agree (scale points 4-5) versus Disagree (scale points 1-2) versus Neutral (scale point 3) –> Here, you are categorizing your data as 3 groups of nominal data.
- If you consider your data as separate categorical data in increasing/decreasing order of 1-Strongly Disagree, 2-Disagree, 3-Neutral, 4-Agree, 5-Strongly Agree –> In this case, you are considering your data as ORDinal data (there is an ORDer to your data).
- If you have just given a scale with the ends defined (1-Strongly Disagree and 5-Strongly Agree), but your participants can choose anywhere in between 1-5 [e.g. they can choose whole numbers like 2, or even half-points like 3.5], then you are considering your data as continuous data.
- If you have a predefined scale [1-Strongly Disagree, 2-Disagree, 3-Neutral, 4-Agree, 5-Strongly Agree] but you are combining several questions/items into another category.
For instance, if you are measuring the user-friendliness of an application with 3 questions:- Q1: The application is easy to use.
- Q2: I can navigate the application easily.
- Q3: The content in the application is easy to understand.
- User-friendliness = Average(Q1+Q2+Q3)
Even though your Likert scale is ordinal, by getting the average of the 3 questions/items for the “user-friendliness” category, you are converting the participants’ responses into continuous data, and hence, the data should be analyzed as continous (not ordinal).
- Agree (scale points 4-5) versus Disagree/Neutral (scale points 1-3) –> In this case, you are categorizing your data as 2 groups of NOminal data (there is No Order to your data).
So, which option to choose to analyze your data depends on your study design, what do you really want to get out of your data, and the context of your study. Think about what is the most logical way to analyze based on what you want to find out.
Confusing? Hopefully after you explore the videos and flowcharts below, it will give you an idea of how your want to start your analysis.
The credits to the videos and pictures all belong to the creators, and I do not take any credit from them. If you do not understand, I advise you to continue searching for appropriate videos to improve your understanding before you start your analysis.
How do I know which statistical test to use?
I have listed 2 YouTube videos here in this section. Hopefully, one of them can help you understand enough to help you extrapolate the concepts to your own study. Remember, think about your own study context as you go through these videos to identify what sorts of data you are analyzing in your study.
What types of analyses should I consider for my data?
These 3 videos help you understand what types of data your study may be collecting and what sorts of data analysis you should be considering. As what I usually advise my project students, start from the basics again.
Navigate your way using biostatistical flowcharts
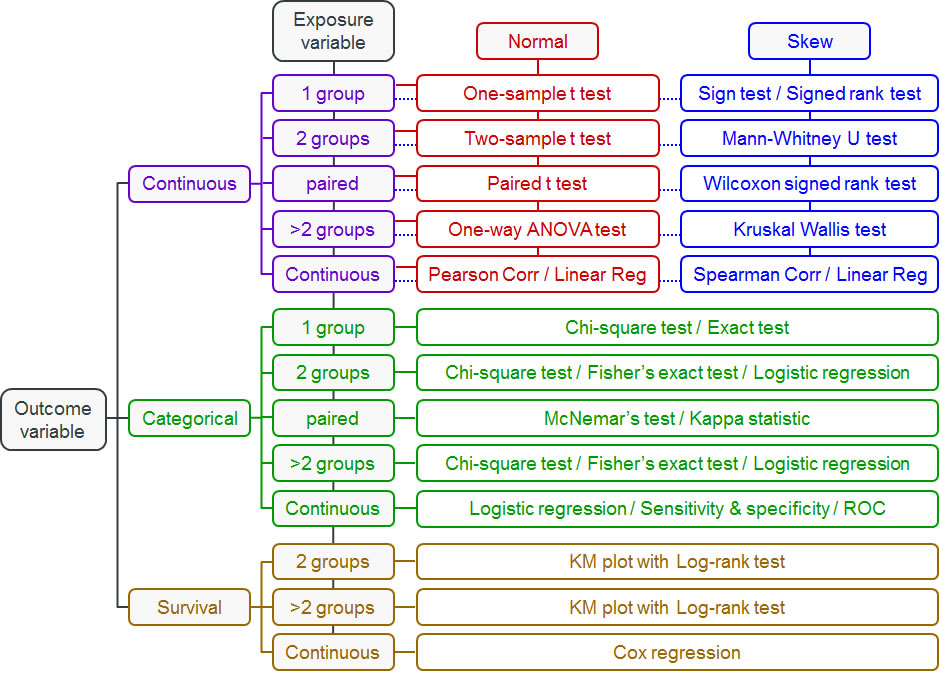
I have done a quick Google search and found the flowcharts and video below quite useful for learning. If you are at the point where you don’t really know what kinds of tests to use for your data, watch the video and look at these flowcharts. While these charts are not exhaustive in terms of the types of tests to use, I have chosen them because they are simple to understand. Use these charts as a basis and then Google or ask your favourite Gen AI chatbot for more information on how to conduct these tests in your statistical program/software.
Disclaimer: I do not guarantee the accuracy or reliability of these tests. Users are encouraged to find out more about these tests to identify if the tests are appropriate for their data and analyses.
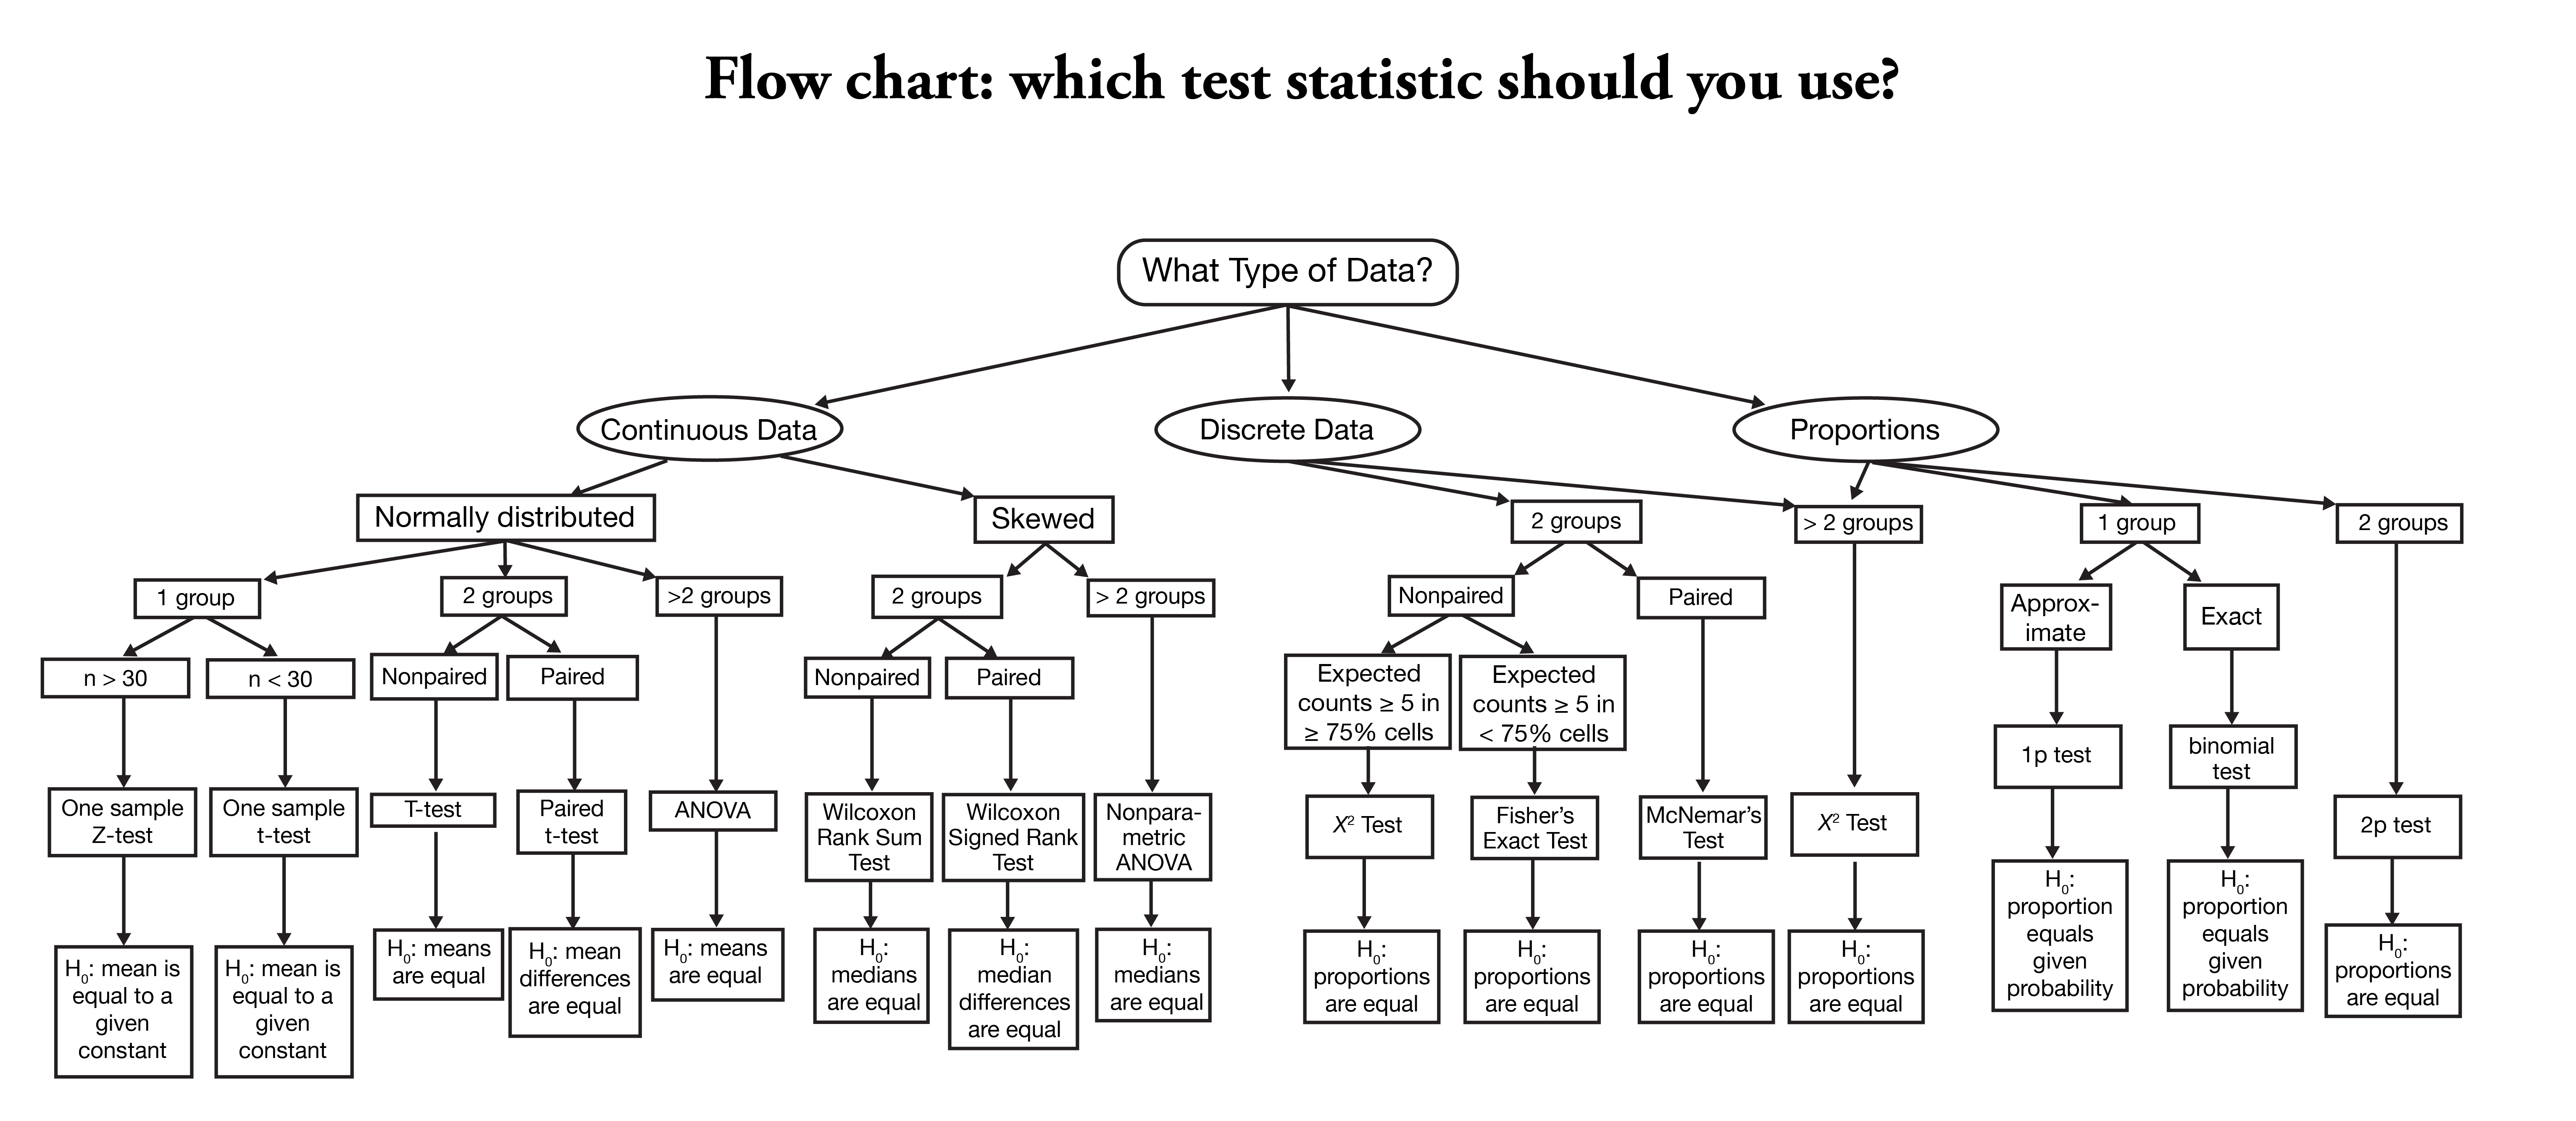
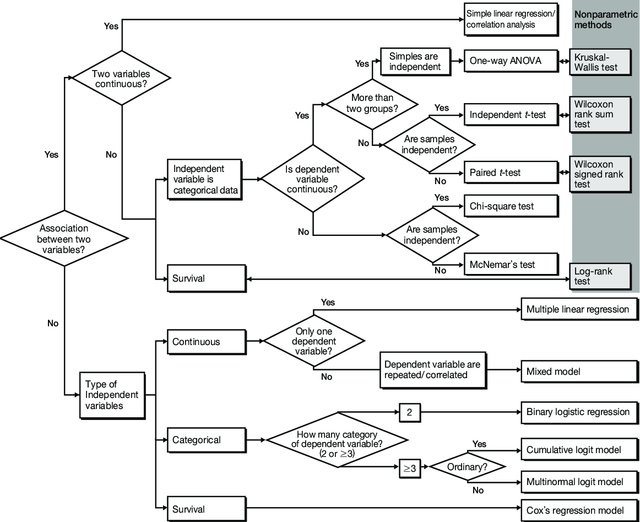
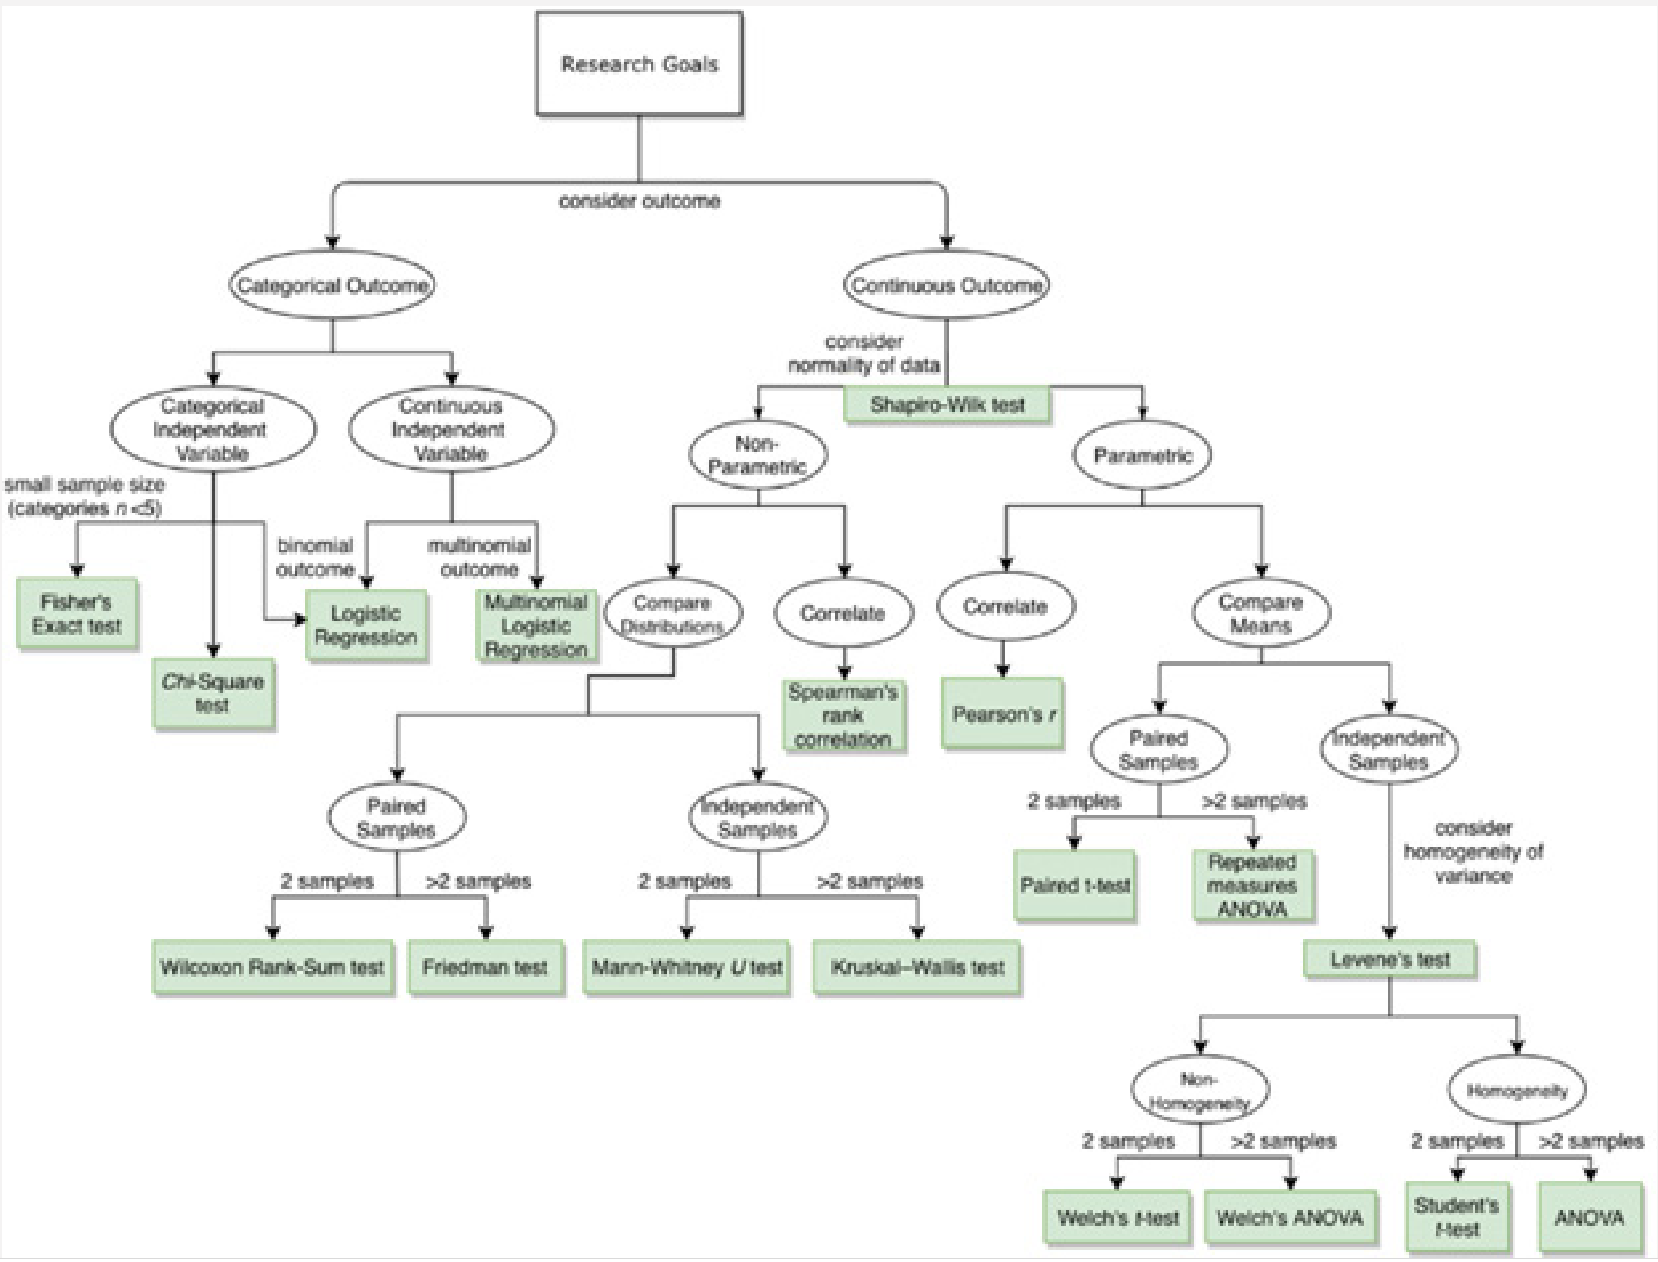
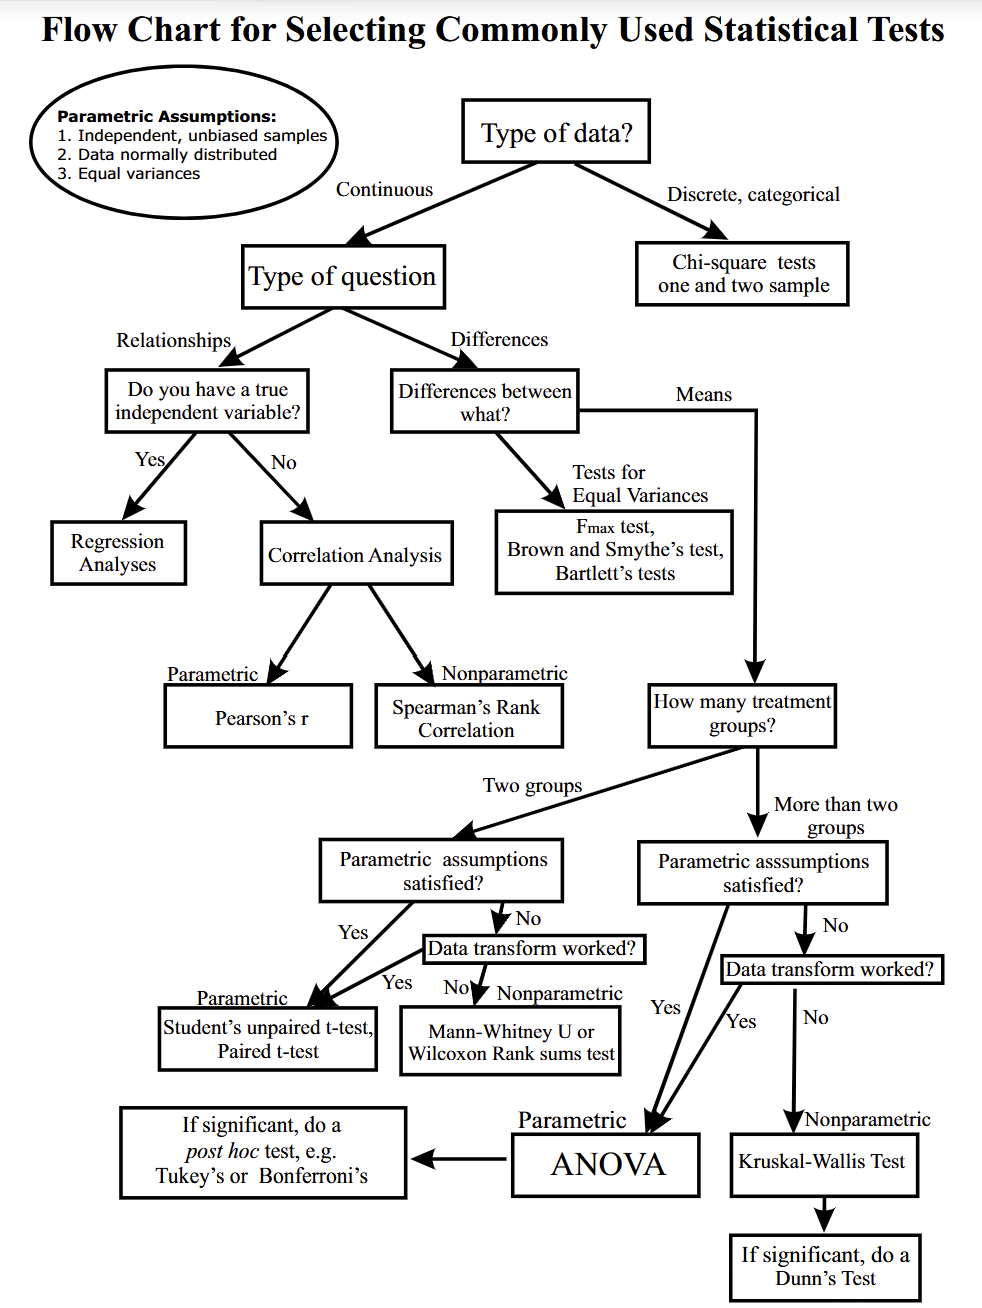
Now that you understand how to navigate the flowcharts from the video, I have included several other flowcharts below, but the credit goes to the orginal sources. I have listed them here for convenience, and in no particular order. Use the one that you find it the easiest to understand and follow.
If you have not watched the video above, I suggest watching it to understand how to navigate biostatistical flowcharts, as you may need or encounter more complicated ones than those that I have provided below.
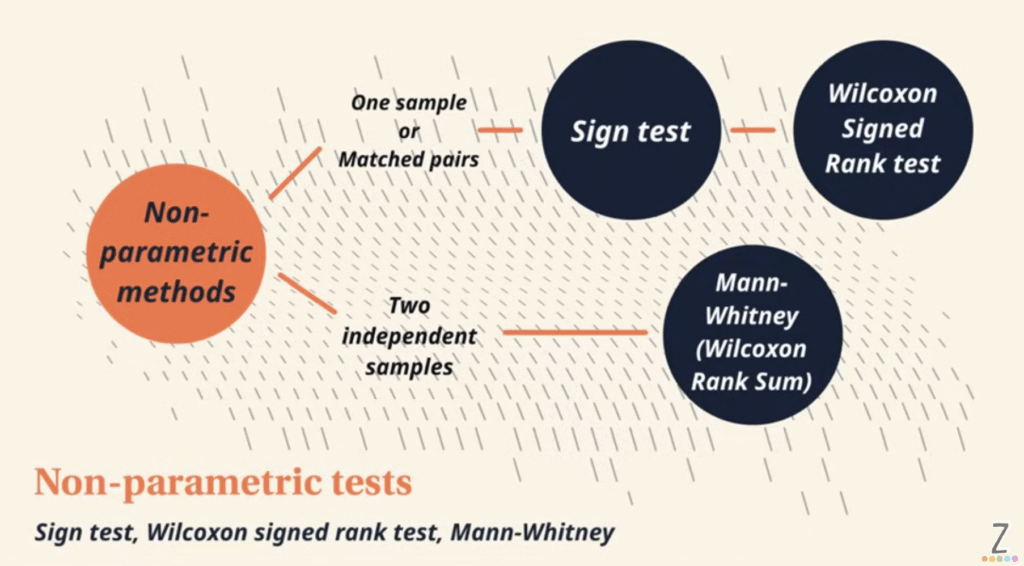
[Note: Wilcoxon rank-sum test is also known as the Mann Whitney U test, which is used for independent, non-paired samples. The Wilcoxon signed rank test should be used for paired samples.]
Confusion among the Wilcoxon tests
Many non-statisticians get confused between the various “Wilcoxon” tests. I hope that by providing these links, it will be clearer to students as to which test to use for their analysis. Do note that just by saying that a Wilcoxon test was done in your report/thesis, it can get confusing as there are different tests and you should state which specific Wilcoxon test was done for which datasets in your report/thesis.
Some useful links include:
- https://www.graphpad.com/guides/prism/latest/statistics/stat_the_wilcoxon_test_can_refer_to.htm
- https://tilburgsciencehub.com/topics/analyze/tests/non-parametric/wilcoxon/
Learn more about these tests in this video by ZedStatistics:
The slide below from the above video shows a summary of the “Wilcoxon” tests:
I hope that this page has been a useful resource for your analysis needs. If you think this page is useful for your colleagues, friends and classmates, please share it.
If you have further queries, or if you have other resources that you think would be useful for other readers, please let me know.